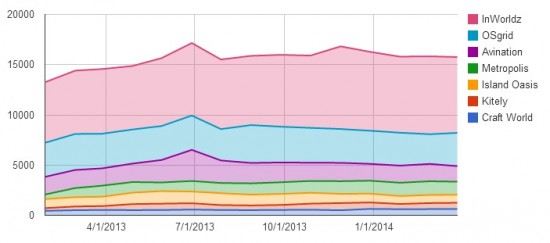
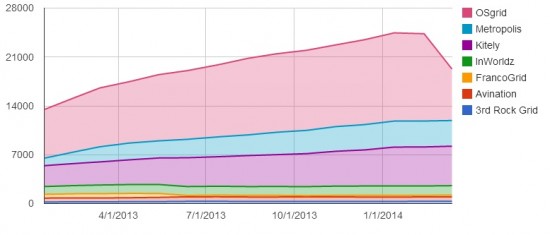
Journalists know that the best ways to get the public’s attention are sex, money, violence — and rankings.
This is why when there’s an important story to be covered that the public needs to know about, but it doesn’t involve any of the first three topics, rankings come into play.
Take political races, as boring a subject as anything on the planet. But add surveys and polls, a little bit of horserace coverage, handicapping, election predictions — and suddenly it gets interesting. We start caring about the candidates, and, in the process learn that one of them is in favor of the death penalty for overdue library books and the other one believes that a giant spaghetti monster created the universe and now wants him to make meatballs out of illegal immigrants.

That’s the main reason why I care about OpenSim statistics. Because it makes OpenSim interesting. And, until we get some sex, money or violence on the grids, that’s the only thing we’ve got going.
Which reminds me: why hasn’t anyone launched a grid yet where they charge people a lot of money to be whipped while naked?

But stats serve practical purposes, as well.
For example, when a newcomer looks at all the OpenSim grids out there, it can get overwhelming. But if there’s a ranking, they might say, oh, look, this grid is the most popular. And this grid is the cheapest. And this grid is the biggest.
It makes it easier to get into OpenSim in the first place.
And, once they’ve gotten over that first hurdle of creating a new user account, and configuring the viewer, they’re more likely to explore other OpenSim grids until they finally find one that’s a perfect fit.
Merchants and performers might also want to start out on the grids that get the most traffic.
Most public grids currently report three statistics — total number of regions, total registered users, and active 30-day users. I collect these and either I or an assistant spend two or three full days every month putting them into a report.

It’s a lot of work and it gets worse each month. We’ve got more and more grids. And the stats are hidden in all sorts of places on websites, in all possible languages and phrasings, making automated scraping very difficult. If anyone is listening — if you have one of those sites, please, please create a simple stats page with the data in English and send me the link! I would be so ever grateful!
But one thing that we don’t have, at all, is good hypergrid stats.
Here are some possible solutions:
Fix Hyperica
I know, I know, I’m working on this. All the gates in the Hyperica hyperport are broken. Each time the region restarts, everything gets re-generated and we wind up with gates on top of gates on top of gates. We need to clear everything out and start from scratch, with new gates, and new scripts.
Once we do, we can start tracking what the popular destinations are — at least, on Hyperica.
Automate hypergrid stats collection via scripts or bots
There are OpenSim scripting commands that you can use to find out whether a particular region on another grid is up or not.
In theory, I can use this to create a database of all the regions on all the grids and track their uptime percentage. This would be very useful for hypergrid travelers, and would also be a great way to double-check grid size statistics.
There’s an outfit called GridSurvey that does just that for Second Life. They also have a bot that visits each region once or twice a month.
My question is, how do you get the list of regions in the first place? Does anyone have any suggestions?

Some grids publish them on their websites or on their login screens, such as Japan Open Grid, above. But most grids don’t.
Does anyone have any ideas about how GridSurvey does it?
Collect stats with OpenSim module
Another approach is to create an OpenSim module that grid owners would install and run that collects and reports stats. For example, when queried, it could report the total number of regions, or the total number of users currently logged on, or current traffic numbers — which regions have avatars on them, and how many.
To reduce workload the module could, say, update its stats once and hour and publish them in XML format for anyone to grab, or for authorized users to grab.

By distributing the module in pre-compiled form, grid owners wouldn’t be able to modify it and mess with the numbers, so the stats would be reasonably trustworthy.
The downside, of course, is that grid owners would have to go out and install this module, something smaller grids aren’t likely to do because they just don’t have the time or technical skills, and large grids might not want to do because they might not want to disclose that data.
In-world scripted objects
Google Analytics works by giving site owners a little snippet of code that they can add to their webpages.
The same approach can be used with in-world scripted objects.
For example, grid owners could put up little Hypergrid Business traffic counters on their regions. The counters would track unique avatar names and generate traffic reports for the object owners and, with permission, for Hypergrid Business.

This method depends completely on the good will of the region owners, however. If they don’t want to have a counter, they don’t have to have one. And, in fact, if they have to go out of their way to get one and install it, the vast majority aren’t likely to do it.
A modest proposal
I’m thinking of a three-prong approach to tracking hypergrid growth.
1. Figure out a way to get the names of active regions on a grid, and track whether those regions are up or not. No idea how this would work with Kitely-style on-demand regions, of course, but otherwise it would give a good sense of the size of the hypergrid.
2. Offer region owners a simple visitor counter that they can install if they want their destinations to be on our most popular hypergrid locations list.
3. Track users on the Hyperica grid and website to learn which destinations, grids, and content hypergrid travelers are searching for.
Any thoughts? Suggestions?
- OSgrid back online after extended maintenance - April 16, 2025
- Analysts predict drop in headset sales this year - March 25, 2025
- OSgrid enters immediate long-term maintenance - March 5, 2025
